SSDs: A gift and a curse

Artur Bergman, founder of a CDN exclusively powered by super fast SSDs, has made many compelling cases over the years to use them. He was definitely ahead of the curve here, but he’s right. Nowadays, they’re denser, 100x faster and as competitively priced as hard disks in most server configurations.

At Etsy, we’ve been trying to get on this bandwagon for the last 5 years too. It’s got a lot better value for money in the last year, so we’ve gone from “dipping our toes in the water” to “ORDER EVERYTHING WITH SSDs!” pretty rapidly.

This isn’t a post about how great SSDs are though: Seriously, they’re amazing. The new Dell R630 allows for 24x 960GB 1.8″ SSDs in a 1U chassis. That’s 19TB usable ludicrously fast, sub millisecond latency storage after RAID6, that will blow away anything you can get on spinning rust, use less power, and is actually reasonably priced per GB.
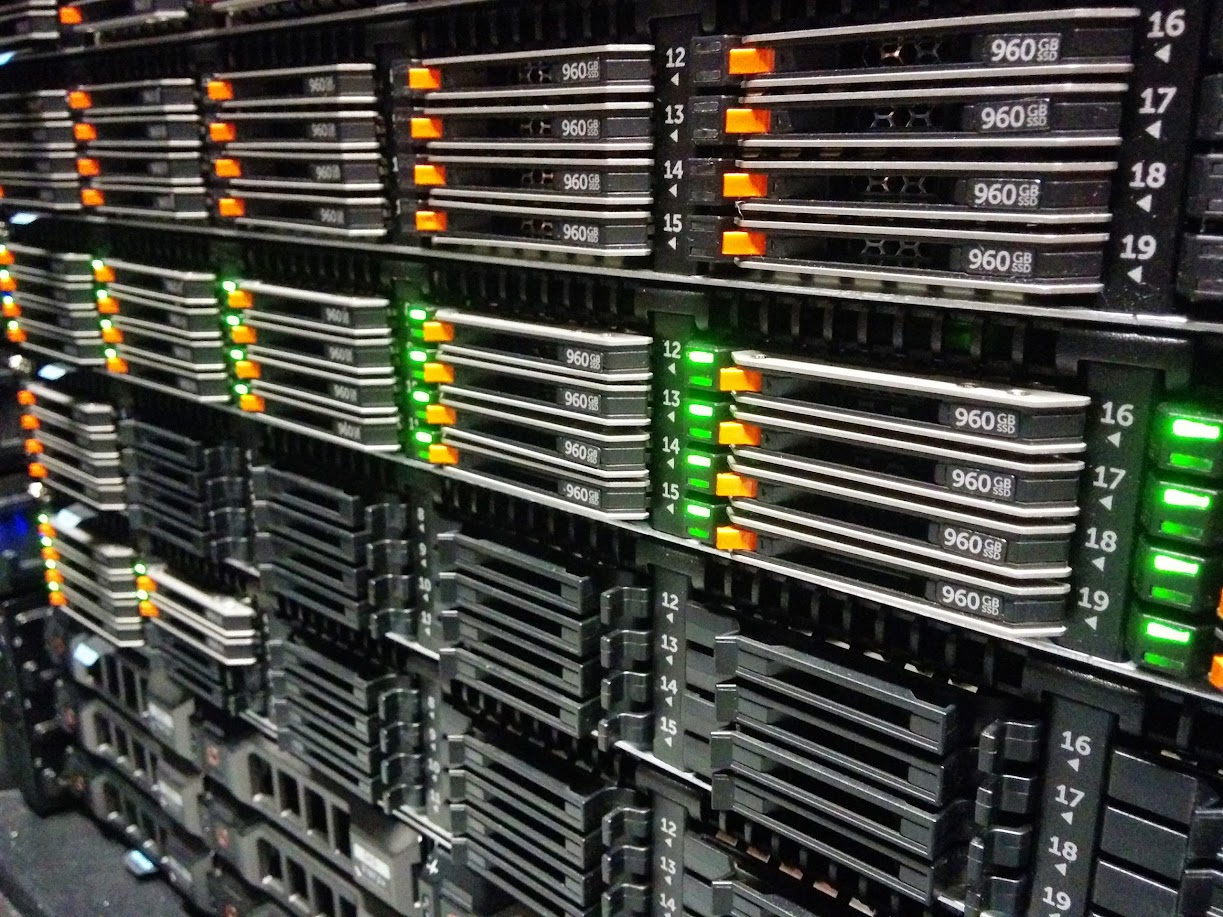
Picture of Dell R630, 24x 960GB SSDs in 1U chassis
Plus, they look amazing.

So if this post isn’t “GO BUY ALL THE SSDs NOW”, what is it? Well, it’s a cautionary tale that it’s not all unicorns and IOPs.

The problem(s) with SSDs

When SSDs first started to come out, people were concerned that these drives “only” handled a certain number of operations or data during their lifetime, and they’d be changing SSDs far more frequently than conventional spinning rust. Actually, that’s totally not the case and we haven’t experienced that at all. We have thousands of SSDs, and we’ve lost maybe one or two to old age, and it probably wasn’t wear related.

Spoiler alert: SSD firmware is buggy

When was the last time your hard disk failed because the firmware did something whacky? Well, Seagate had a pretty famous case back in 2009 where the drives may not ever power on again if you power them off. Whoops.

But the majority of times, the issue is the physical hardware… The infamous “spinning rust” that is in the drive.

So, SSDs solve this forever right? No moving parts.. Measured mean time to failure of hundreds of years before the memory wears out? Perfect!

Here’s the run down of the firmware issues we’ve had over 5 or so years:

Intel

Okay, bad start, we’ve actually had no issues with Intel. This seems to be common across other companies we’ve spoken to. We started putting single 160GB in our web servers about 4 years ago, because it gave us low power, fast, reliable storage and the space requirements for web servers and utility boxes was low anyway. No more waiting for the metal to seize up! We have SSDs that have long outlived the servers.

OCZ

Outside of the 160GB Intel drives, our search (Solr) stack was the first to benefit from denser, fast storage. Search indexes were getting big; too big for memory. In addition, getting them off disk and serving search results to users was limited by the random disk latency.

Rather than many expensive, relatively fast but low capacity spinning rust drives in a RAID array, we opted for OCZ Talos 960GB disks. These weren’t too bad; we had a spate of initial failures in what seemed like a bad batch, but we were able to learn from this and make the app more resilient to failures.

However, they had poor SMART info (none) so predicting failures was hard.

Unfortunately, the company later went bankrupt, and Toshiba rescued them from the dead. They were unavailable for long enough that we simply ditched them and moved on.

HP SSDs

We briefly tried running third party SSDs on our older (HP) Graphite boxes… This was a quick, fairly cheap win as it got us a tonne of performance for relatively little money (back then we needed much less Graphite storage). This worked fine until the drives started to fail.

Unfortunately, HP have proprietary RAID controllers, and they don’t support SMART. Or rather, they refuse to talk to non-HP drives using off the shelf technology, they have their own methods.

Slot an unsupported disk or SSD into the controller, and you have no idea how that drive is performing or failing. We quickly learnt this after running for a while on these boxes, and performance randomly tanked. The SSDs underlying the RAID array seemed to be dying and slowing down, and we had no way of knowing which one (or ones), or how to fix it. Presumably the drives were not being issued TRIM commands either.

When we had to purchase a new box for our primary database this left us with no choice: We have to pay HP for SSDs. 960GB SSDs direct from HP, properly supported, cost us around $7000 each. Yes, each. We had to buy 4 of them to get the storage we needed.

On the upside, they do have fancy detailed stats (like wear levelling) exposed via the controller and ILO, and none have failed yet almost 3 years on (in fact, they’re all showing 99% health). You get what you pay for, luckily.

Samsung

Samsung saved the day and picked up from OCZ with a ludicrously cheap 960GB offering, the 840 EVO. A consumer drive, so very limited warranty, but for the price (~$400-500) you got great IOPS and they were reliable. They had better SMART info, and seemed to play nicely with our hardware.

We have a lot of these drives:

[~/chef-repo (master)] $ knife search node block_device_sda_model:'Samsung' -a block_device.sda.model

117 items found

That’s 117 hosts with those drives, most of them have 6 each, and doesn’t include hosts that have them behind RAID controllers (for example, our Graphite boxes). In particular, they’ve been awesome for our ELK logging cluster

Then BB6Q happened…

I hinted that we used these for Graphite. They worked great! Who wouldn’t want thousands and thousands of IOPs for relatively little money? Buying SSDs from OEMs is still expensive, and they give you those darn fancy “enterprise” level drives. Pfft. Redundancy at the app level, right?

We had started buying Dell, who use a rebranded LSI RAID controller so they happily talked to the drives including providing full SMART info. We had 16 of those Samsung drives behind the Dell controller giving us 7.3TB of super fast storage.

Given the already proven pattern, we ordered the same spec box for a Ganglia hardware refresh. And they didn’t work. The RAID controller hung on startup trying to initialise the drives, so long that the Boot ROM was never loaded so it was impossible to boot from an array created using them.

What had changed?! A quick

"MegaCli -AdpAllInfo -a0 | diff"

on the two boxes, revealed: The firmware on the drive had changed. (shout out to those of you who know the MegaCli parameters by heart now…)

Weeks of debugging and back and forth with both Dell (who were very nice given these drives were unsupported) and Samsung revealed there were definitely firmware issues with this particular BB6Q release.

It was soon released publicly, that not only did this new firmware somehow break compatibility with Dell RAID controllers (by accident), but they also had a crippling performance bug… They got slower and slower over time, because they had messed up their block allocation algorithm.

In the end, behind LSI controllers, it was the controller sending particular ATA commands to the drives that would make them hang and not respond.. And so the RAID controller would have to wait for it to time out.

Samsung put out a firmware updater and “fixer” tool for this, but it needed to move your data around so only ran on Windows with NTFS.

With hundreds of these things that are in production and working, but have a crippling performance issue, we had to figure out how they would get flashed. An awesome contractor for Samsung agreed that if we drove over batches of drives (luckily, they are incredibly close to our datacenter) they would flash them and return them the next day.

This story has a relatively happy ending then; our drives are getting fixed, and we’re still buying their drives; now the 960GB 850 PRO model, as they remain a great value for money high performance drive.

Talking with other companies, we’re not alone with Samsung issues like this, even the 840 PRO has some issues that require hard power cycles to fix. But the price is hard to beat, especially now the 850 range is looking more solid.

LiteOn

LiteOn were famously known for making CD writers back when CD writers were new and exciting.

But they’re also a chosen OEM partner of Dell’s for their official “value” SSDs. Value is a relative term here, but they’re infinitely cheaper than HP’s offerings, enterprise level, fully supported and for all that, “only” twice the price of Samsung (~$940)

We decided to buy new SSD based database boxes, because SSDs were too hard to resist for these use cases; crazy performance and at 1TB capacity, not too much more expensive per GB than spinning rust. We had to buy many many 15,000rpm drives to even get near the performance, and they were expensive at 300GB capacity. We could spend a bit more money and save power, rack space, and get more disk space and IOPs.

For similar reasons to HP, we thought best to pay the premium for a fully supported solution, especially as Samsung had just caused all these issue with their firmware issues.

With that in mind, we ordered some R630’s hot off the production line with 960GB LiteOn’s, tested performance, and it was great: 30,000 random write IOPs across 4 SSDs in RAID6, (5.5 TB useable space).

We put them live, and they promptly blew up spectacularly. (Yes, we had a postmortem about this). The RAID controller claimed that two drives had died simultaneously, with another being reset by the adapter. Did we really get two disks to die at once?

This took months of working closely with Dell to figure out. Replacement of drives, backplane, and then the whole box, but the problem persisted. Just a few short hours of intense IO, especially on a box with only 4 SSDs would cause them to flip out. And in the mean time, we’d ordered 50+ of these boxes with varying amounts of SSDs installed, having tested so well initially.

Eventually it transpires that, like most good problems, it was a combination of many factors that caused these issues. The SSDs were having extended garbage collection periods, exacerbated by a smaller amount of SSDs with higher IO, in RAID6. This caused the controller to kick the drive out of the array… and unfortunately due to the write levelling across the drives, at least two of them were garbage collecting at the same time, destroying the array integrity.

The fix was no small deal; Dell and LiteOn together identified and fixed weaknesses in their RAID controller, the backplane and the SSD firmware. It was great to see the companies working together rather than just pointing fingers here, and the fixes for all sizes except 960GB was out within a month.

The story here continues for us though; the 960GB drive remains unsolved, as it caused more issues, and we had almost exclusively purchased those. For systems that weren’t fully loaded, Dell kindly provided us with 800GB replacements and extra drives to make up the space. For the rest, because the stress across the 22 drives means garbage collection isn’t as intense, so they remain operating until a firmware fix.

Summary

I’m hesitant to recommend any one particular brand, because I’m sure as with the hard disk phenomenon (Law where each person has their preferred brand that they’ve never had issues with but everyone else has), people’s experiences will have varied.

We should probably collect some real data on this as an industry and share it around; I’ve always been of the mindset that we’re weirdly secretive sometimes of what hardware/software we use but we should share, so if anyone wants to contribute let me know.

But: you can probably continue to buy Intel and Samsung, depending on your use case/budget, and as usual, own your own availability and add resiliency to your apps and hardware, because things always fail in ways you can’t imagine.

systemd: Using ExecStop to depool nodes for fun and profit

Preface: There is a tonne of drama about systemd on the internets; it won’t take you long to find it, if you’re curious. Despite that, I’m largely a fan and focusing on all the cool stuff I can finally do as an ops person without basically re-writing crappy bash scripts for a living (cough sys-v init) 

Process Supervision

Without going into the basics about systemd too much (I quite enjoy this post as an intro), you tell systemd to run your executable using the “ExecStart” part of the config, and it will go and run that command and make sure it keeps running. Wonderful! In this case, we wanted to keep HHVM running all the time, so we told systemd to do it, in 3 lines. Waaaay easier than sys-v init.

ExecStop

By default when you tell systemd to stop a process, and you haven’t told it how to stop the process, it’s just going to gracefully kill the process and any other processes it spawned.

However, there is also the ExecStop configuration option that will be executed before systemd kills your processes, adding a new “deactivating” step to the process. It takes any executable name (or many) as an argument, so you can abuse this to do literally anything as cleanup before your processes get killed.

Systemd will also continue to do it’s regular killing of processes if by the end of running your ExecStop script the processes are not all dead.

Load balancer health checks

We have a load balancer that uses a bunch of health checks to ensure that the node that it’s asking to do work can actually still do work before it sends it there.

One of these is hitting an HTTP endpoint we set up, let’s call it “status.php” which just contains the text “Status:OK”. This way, if the server dies, or PHP breaks, or Apache breaks, that node will be automatically depooled and we don’t serve garbage to the user. Yay!

Example: automatic depooling using ExecStop

Armed with my new ExecStop super power, I realised we were able to let the load balancer know this node was no longer available before killing the process.

I wrote a simple bash script that:

  • Moves the status.php file to status.php.disabled
  • Starts pinging the built in HHVM “load” endpoint (which tells you how many requests are in flight in HHVM) to see if the load has hit 0
  • if the curl to the “load” endpoint fails, we try again after 1 second
  • If we hit 30 seconds and the load isn’t 0 or we still can’t reach the endpoint, we just carry on anyway; something is wrong.
  • Once the load is “0”, we can continue
  • use `pidof` to kill the HHVM process
  • Move status.php.disabled back to status.php

And now, i can reference this in our HHVM systemd unit file:

[Unit]
Description=HHVM HipHop Virtual Machine (FCGI)

[Service]
Restart=always
ExecStart=/usr/bin/hhvm -c <snip>
ExecStop=/usr/local/bin/hhvm_stop.sh

Now when I call service hhvm stop, it takes 6-10 seconds for the stop to complete, because the traffic is gracefully removed.

Logging

Another thing I personally love about systemd, is the increase visibility the operator gets about what’s going on. In sys-v, if you’re lucky, someone put a “status” action in their bash script and it might tell you if the pid exists.

In systemd, you get a tonne of information about what’s going on; the processes that have been launched (including child processes), the PIDs, logs associated with that process, and in the case of something like Apache, the process can report information back:

Apache systemd status output showing requests per second

In this case, our ExecStop script output gets shown when you look at the status output of systemd:

[root@hhvm01 ~]# systemctl status hhvm -l
hhvm.service - HHVM HipHop Virtual Machine (FCGI)
   Loaded: loaded (/usr/lib/systemd/system/hhvm.service; enabled)
   Active: inactive (dead) since Tue 2015-02-17 22:00:52 UTC; 48s ago
  Process: 23889 ExecStop=/usr/local/bin/hhvm_stop.sh (code=exited, status=0/SUCCESS)
  Process: 37601 ExecStart=/usr/bin/hhvm <snip> (code=killed, signal=TERM)
  Main PID: 37601 (code=killed, signal=TERM)

Feb 17 22:00:45 hhvm01 hhvm_stop.sh[23889]: Moving status.php to status.php.disabled
Feb 17 22:00:47 hhvm01 hvm_stop.sh[23889]: Waiting another second (currently up to 8) because the load is still 16
Feb 17 22:00:48 hhvm01 hhvm_stop.sh[23889]: Waiting another second (currently up to 9) because the load is still 10
Feb 17 22:00:49 hhvm01 hhvm_stop.sh[23889]: Waiting another second (currently up to 10) because the load is still 10
Feb 17 22:00:50 hhvm01 hhvm_stop.sh[23889]: Load was 0 after 11 seconds, now we can kill HHVM.
Feb 17 22:00:50 hhvm01 hhvm_stop.sh[23889]: Killing HHVM
Feb 17 22:00:52 hhvm01 hhvm_stop.sh[23889]: Flipping status.php.disabled to status.php
Feb 17 22:00:52 hhvm01 systemd[1]: Stopped HHVM HipHop Virtual Machine (FCGI).

Now all the information about what happened during the ExecStop process is captured for debugging later! No more having no idea what happened during the shut down.

When the script is in the process of running, the systemd status output will show as “deactivating” so you know it’s still ongoing.


Summary

This is just one example of how you might use/abuse the ExecStop to do work before killing processes. Whilst this was technically possible before, IMO the ease of use and the added introspection means this is actually feasible for production systems.

I’ve gisted a copy of the script here, if you want to steal it and modify it for your own use.

Hadoop and Ganglia 3.1

A quick note to anyone setting up a new Hadoop cluster and hoping to quickly use the built in Ganglia metrics collection (which you should! If it moves, graph it!): This works out of the box with Ganglia 3.0, but the protocol changed with Ganglia 3.1.

The official GangliaMetrics pages talks about this, and talks about patching (which is already available if you use the Cloudera releases) but doesn’t go into more detail than that. I recently set up a new cluster, and remembered there was something I had to change in the default config to make it work out of the box… After inquiring (and finding the comment I left in my old config file!) I remembered, you must change the default class to have “31” (e.g. Ganglia 3.1) on the end.

For example, the default config file: (Replacing @GANGLIA@ with your multicast address)

dfs.class=org.apache.hadoop.metrics.ganglia.GangliaContext
dfs.period=10
dfs.servers=@GANGLIA@:8649

mapred.class=org.apache.hadoop.metrics.ganglia.GangliaContext
mapred.period=10
mapred.servers=@GANGLIA@:8649

jvm.class=org.apache.hadoop.metrics.ganglia.GangliaContext
jvm.period=10
jvm.servers=@GANGLIA@:8649

rpc.class=org.apache.hadoop.metrics.ganglia.GangliaContext
rpc.period=10
rpc.servers=@GANGLIA@:8649

Is changed to this:

dfs.class=org.apache.hadoop.metrics.ganglia.GangliaContext31
dfs.period=10
dfs.servers=@GANGLIA@:8649

mapred.class=org.apache.hadoop.metrics.ganglia.GangliaContext31
mapred.period=10
mapred.servers=@GANGLIA@:8649

jvm.class=org.apache.hadoop.metrics.ganglia.GangliaContext31
jvm.period=10
jvm.servers=@GANGLIA@:8649

rpc.class=org.apache.hadoop.metrics.ganglia.GangliaContext31
rpc.period=10
rpc.servers=@GANGLIA@:8649

Restart the cluster, and the graphs will appear under each host in the Ganglia interface.

There is a LOT of detail in these graphs, with metrics ranging from DFS (things like bytes written, and how many operations were transferred from other nodes) to the JVM (monitor those heap memory sizes!)

This is probably old news to most people I’m sure, but I have a rule that if I didn’t find it within 30 minutes, maybe this will help someone in the same boat as me 🙂

Naglite2 finally released

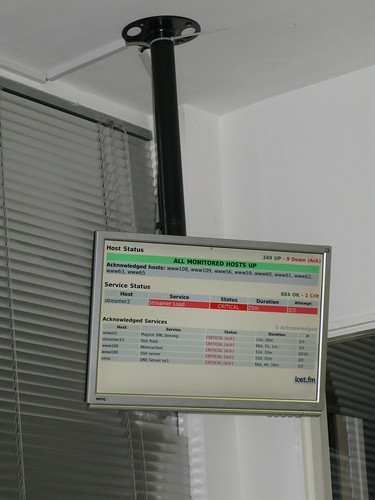
It’s been a long time coming (even longer than CactiView!) but finally I’ve cleaned up (as much as possible) and released Naglite2, a full screen easy to read status screen backed on to Nagios.

Naglite2

Perfect for a NOC or operations room, you get a at-a-glance view of your hosts and services status, which not only helps in sudden emergencies but also incentivise  your staff to get a “clean board” and fix the remaining niggly problems in your network!

The screen also compresses down quite nicely into a mobile browser, perfect for checking on the status of your systems whilst on the move.

The code is up over at Github, feel free to use/distribute/fork and modify or send me comments.

Get Naglite2 now

CactiView

It’s been a while coming and I apologise to those who have been waiting but finally I have publicly released CactiView.

CactiView

All the details are in the README inside the tar.gz, but here is a quick description for those who do not know:

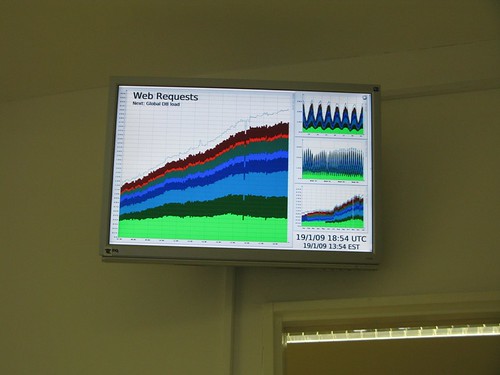
CactiView gives you a clean and simple view of one graph from Cacti at a time. You can
name the graphs, and set the automatic rotation duration.

The display includes one main large graph for the last 12 hours, 3 smaller graphs with longer time periods and a couple of other bits and bobs of information.

Please let me know what you think.

CactiView is available for download here: http://denness.net/downloads/cactiview-0.1.tar.gz

Or on Github here: http://github.com/lozzd/CactiView/

Setting up a DRAC card using Debian

Today I was faced with the problem of setting the IP address of a DRAC (dedicated Dell Remote Access Card, which are super by the way, and a lot lot quicker than Sun’s effort) in a Dell server that was powered on, running something production on the Debian OS, and I had no physical access to the server, so no rebooting for configuration was possible.

Now, if you have an idea of what IP address is on that card already you can talk to it remotely which isn’t a problem. The problem was, I had no idea what the IP address was currently set it to and it wasn’t DHCP. Even so, I had no copy of the racadm command, the Dell tool to control the card. (omconfig is available on Debian now which is nice, but omconfig bmc is a deprecated command and indicates to use racadm!)

Let me tell you how to set the IP address with just a simple install of Debian and little effort. (I’m sure this on the internet somewhere but I had difficulties finding it. I expect my Google-fu was weak today.)

Install IPMItool from apt:

apt-get install ipmitool

Load the IPMI driver into /dev/ so we can talk to the card:

/usr/share/ipmitool/ipmi.init.basic

You can now print the current config of the card:

ipmitool lan print 1

Set the new IP address up, if you want to configure it manually:

ipmitool lan set 1 ipaddr 172.0.0.10
ipmitool lan set 1 netmask 255.255.255.0
ipmitool lan set 1 defgw ipaddr 172.0.0.1
ipmitool lan set 1 ipsrc static

Or set it to DHCP if you want:

ipmitool lan set 1 ipsrc dhcp

Check your settings:

ipmitool lan print 1

Reboot the DRAC; You may not have to do this, I did (and/or I’m impatient)

ipmitool mc reset cold

Within a minute the card should be up and responding to ping. Hurrah!

Note: I tried these on a DRAC4 card, and whilst it looked like it was accepting my instructions, it seems it was infact completely ignoring me. I had to configure this one manually in the BIOS. These commands work fine on a DRAC5 though.

Finding a Web Browser for constant page reloading

One of the things I have done whilst working at Last.fm is create a simple system whereby critical monitoring is displayed on screens that we have hanging from the ceiling. There is one in each corner of the room, and opposite monitors display the same thing (e.g. two monitors display our key Cacti graphs, and two display Nagios monitoring output, so everyone in the room can see it). This is achieved through a simple dual output graphics card, and a couple of two-way monitor splitters (and a lot of cable!)

The software itself is simple: The data is displaying using some PHP scripts written by myself specifically for output on these 22″ screens, and are hosted on our servers, so all that is required to display them is a web browser.You can see these two pages in action here (Naglite2) and here (CactiView)

Very simple, or so you would think. The problem is, with the nature of this data, it needs to be refreshed constantly. The graphs are in a rotation controlled by a Javascript frame that changes to a new URL every 20 seconds, and the services/host up/down notification screen updates with a meta refresh every 5 seconds. Again, sounds pretty simple. Here are my findings:

Initial Configuration – Ubuntu Linux with Firefox 3

Being my browser of choice anyway, I set everything up in Firefox to start with. We figured Linux desktop would be more stable for hosting this rather than Windows. F11 to fullscreen mode on both the monitors, and off it goes. We didn’t notice it too much at the time, but it’s pretty annoying the way it deals with the refreshing of the images.. It clears the page, and loads the images one by one, leading to a noticable flashing of the screen every time it reloads the page. Not only that, it was the worst browser we used, leading to 90% RAM usage (on a 2gb machine) after just a day. At this point, not only did it become very sluggish, but it would stop displaying the graphs randomly, and eventually ending up in severe corruption of all the images, mixing them together in an interesting fashion. Connecting via VNC every day and restarting Firefox became a bit of a chore, so we decided to give up and try something else.

Second configuration – Ubuntu Linux with Opera

Straight away Opera was performing much better than Firefox. It seemed to almost pre-load the images for the next set of graphs before it refreshed the page, leading to no flickring of the screen, just seamless re-loading of the page. It also managed a week before showing any signs of slowing down, but after that point the graphs started disappearing again. Opera had suffered the same fate as Firefox… Using all the memory available on the machine.

We also had another little problem.. We have the time printed in the bottom right of the screen (as text rather than an image) and even by forcing cache control headers, Opera was caching the pages. The clock would move between 5-10 minutes as each graph appeared. I discovered that Opera has some advanced preferences that lets you disable the cache completely. Whilst this fixed the problem with the clock, it meant that it then only survived 2-3 days before exhausting the memory usage. We put up with this for a number of months, before deciding to move on.

Hello Webkit

At this point, Russ and I thought it was about time we gave a Webkit based browser a shot. Konquerer seemed a good choice.. We installed kubuntu-desktop, and got Konquerer running, but had trouble getting it in a proper full screen mode. Eventually we managed to hide the tab bar, but the status bar was still there. Although we found some hacks to remove it, we wanted to try something in particular, which ended up with a radical change…

Current configuration – Windows XP and Google Chrome

We really wanted to give Google Chrome (Chromium) a go on Linux, but unfortunately it’s not quite at it’s prime yet… More than anything, we couldn’t get the pages to load at all because the HTTP Auth dialog has yet to be coded. (it simply doesn’t appear. As a side note, using the user:password@ url notation makes it crash!)

After a quick hour of installation, drivers and updates, we had the screens back up and running with XP and Chromium. The nice points so far have been:

  • Turning the two different pages we use into their own Apps using the Google Gears “Create application shortcut” menu option. Now we have a single icon to click to open one window, and another for the other.
  • Separate processes – Now we can monitor which tab is using the RAM, and just restartthe offending process if it becomes a problem
  • The biggest win by far – It leaks very little memory. So far after using it for a week, the process running the text only Nagios view has not used any more RAM than it did when we started it (35mb). The Cacti graphs screen, reloading graphs 24/7 for a week every 20 seconds has used just 80mb (40mb when it started). The reason for this is obvious; if you watch the usage, it loads the page, the memory increases by 5mb. After a few secnods, it drops by 5mb again. So there is a small memory leak somewhere but it seems Chrome is cleaning up after itself almost immediately, something which the other 2 browsers failed miserably at.

The overall functionality of the system is much the same.. I have compiled a couple of exe’s so that one switches off the displays and one turns them back on again (This combined with Task Scheduler means we save the planet whilst we’re not at work!) and VNC server functions actually better on Windows than on Linux (for some reason the secondary monitor displayed as a black screen on Linux, so you could control but not see it).

Downsides

The only downside of the Google Chrome based solution is: Webkit doesn’t support “text-decoration: blink”! In the image linked above, you can see we use the text CRITICAL for a service that is broken, and DOWN for a host that is having an issue. These used to blink, which was a nice touch to draw your eye to the issue. This is about the only valid use of “text-decoration: blink” I can think of, but unfortunately the webkit developers have chosen not to support it. Any support on this ticket would be appreciated!

We’re currently using the bleeding edge dev version, simply because it was the only version that had F11 Full screen mode in. This works very well, and it’s also very stable for a bleeding edge release (although obviously we aren’t using it like a regular browser).

Fin

If you’re after a browser that can handle sitting there all day and night happily refreshing a page, and you don’t mind running Windows (for now, anyway) then it seems Google Chrome may be your best bet. I will continue to evaluate it’s performance and maybe one day we can find something even better.

Any comments are welcome and we’re still open to suggestions, although I’m pretty happy I won’t have to restart Chrome for a few months if this trend continues!

Last.fm Beta – Yay!

So we launched a super exciting new beta today.. It’s not very finished, and it’s going to get a lot better, but I’m very excited and here are some quick reasons why.

  1. Activity feeds. For me, I can remember what I shouted, who i added as my friend, what forum posts I made, and more. For my friends, the same, and I can see what’s going on with them. For any other resource: interesting stuff that people have done. Simple but so effectively because its live.
  2. Live updating charts. This makes me happy, because the charts look more like Audioscrobbler ones, and not only that they update every single damn play. Yay!  Every single play means something new to look at!
  3. Notifications. Easy way to see shoutbox posts and other stuff, other than checking my email.
  4. On the fly recommendations. Again, live updating goodness. No need to explain that!
  5. Library. Big, shiny, pretty view of everything you ever played. And finally you can delete that stuff you thought “jesus, why did I play that”? Apparently I listened to 50 cent! I never realised!
  6. Loved Tracks. They’re finally useful! Remember those tracks you loved but you never remembered because we didn’t have them streamable.
  7. The design. I wasn’t sure about it at first, but I think it’s looking pretty nice. Much more up to date than it was before, but it’s got a little way to go.

There are tonnes more awesome stuff going on, and more stuff to be tweaked, improved on, and cool stuff to be added, we’re not done yet! But it’s 11:30 and I’m not exactly sober. Goodnight!

IRC and BES and You

I got this wonderful Blackberry device courtesy of work, since I’m on call and people want emails answering quickly etc, etc.

The miracle of BIM and Google Talk is fantastic.. lots of ways to talk to my fellow operations coworkers, but there was something missing. We use good old IRC at Last.fm to communicate, so when something goes a bit wrong its nice to be able to jump in and see what’s gone on (or whether no one is fixing anything and its up to you..!)

On a first search there was plenty of good IRC clients around. Unfortunately I couldn’t get any to work… They just said disconnected from server. Using MidpSSH I telnet’d to the server and got a connection refused.. Then I changed the connection method to “TCP” and it worked fine. Great! But no such option exists in any IRC client (Mobilirc is the best one at the moment it seems).

So, the BES won’t forward the traffic, the BES isn’t even managed by us, and both apps are open source. Let’s delve into the code!

else if ( spec.blackberryConnType == SessionSpec.BLACKBERRY_CONN_TYPE_DEVICESIDE ) {
conn.append(“;deviceside=true”);

References to “deviceside”… basically it proxies via the BES, so that’s deviceside=false, which is the default if not specified. Funnily enough. Mobilirc doesn’t specifiy this, so I jump in and add the line, so it now looks like this:

connector = (StreamConnection) Connector.open(“socket://” + host + “:” + port + “;deviceside=true”, Connector.READ_WRITE);

After a couple of hours of trying to get the Blackberry Development Environment working for me, I managed to get a .jar, .jad, .alx, .cod, and using javaload, got it on my device and SUCCESS! IRC running, backgrounded, highlights, always on. Hurrah!

I don’t know if this affects anyone, or if anyone else really cares, but if you do, let me know and I’ll send you the stuff. At least we’re happy now 😉 and I’m happy that I still vaguely understand Java! 😀