My my, hasn’t @supersheep stirred up a bit of controversy over Nagios over the last week?
In case you missed it, he brought up an excellent topic that’s close my heart: Nagios. In his words, we should stop using it, so we can let it die. (I read about this in DevOpsWeekly, which you should absolutely sign up to if you haven’t already, it’s fantastic)
Mr Sheep (Andy) brought up some excellent points, and when I read them I must admit getting fairly triggered and angry that someone would speak about one of my favourite things in such a horrible way! Then maybe I started thinking I had a problem. Was I blindly in love with this thing? Naive to the alternatives, a fan boy? Do I need help? Luckily I could reach out to my wonderful coworkers, and @benjammingh was quick to confirm that yes, I do need help, but then again don’t we all. That’s a separate issue.
Anyway, the folks at reddit had plenty to say about this too. Some of the answers are sane, some are… Not so. Other people were seemingly very angry too. I don’t blame them.. It’s a bold move to stand up and say a perfectly good piece of software “sucks” and “you shouldn’t use it”. Which was the intention, of course, to make us talk about it.
Now the dust has settled slightly, I’m going to tell you why I still love Nagios, and why it will be continued to be used at Etsy, addressing the points Andy brought up individually.
“Doesn’t scale at all”
Yeah, that Gearman thing freaks me out too. I don’t think I’d want to use it, even though we use Gearman extremely heavily at Etsy for the site (we even invited the creator in for our Code as Craft speaker series).
But what scale are people taking here? Is it really that hard?
We “only” have 10,000 checks in our primary datacenter, all active, usually on 2-3 minute check intervals with a bunch on 30 seconds. I’m honestly not sure if that’s impressive or embarrassing, but the machine is 80% idle, so it’s not like there isn’t overhead for more. And this isn’t a super-duper spec box by any means. In fact, it’s actually one of the oldest servers we have.
use_large_installation_tweaks
We had to enable use_large_installation_tweaks to get the latency down, but that made absolutely no difference to our Nagios operation. Our check latency is currently 2.324 seconds.
I’m not sure how familiar people are with this flag… Our latency crept up to minutes without it, and it’s not massively well documented online that you can probably enable it with almost no effect to anything except… Making Nagios not suck quite so much.
It’s literally a “go faster” flag.
Disable CPU scaling
Our Nagios boxes are HP or Dell servers, that by default have a “dynamic” CPU scaling setting enabled. Great for power saving, but for some reason the intelligence built into this system is absolutely horrible with Nagios. Because Nagios has extremely high context switches, but relatively low CPU, it causes a lot of problems with the intelligent management. If you’re still having latency issues, set the server to “static high performance mode” or equivalent.
We’ve tested this in a bunch of other places, and the only other place it helped was syslog-ng. Normally it’s pretty smart, but there *are* a few cases that trip it up.
Horizontal Scaling
The reason we’ve ended up with 10,000 checks on that single box is because that datacenter is now full, and we’ve moved onto another one, so we’ve started scaling Nagios horizontally rather than vertically. It makes a lot more sense to have a Nagios instance in each network/datacenter location so you can get a “clean view” of what’s going on inside that datacenter rather than letting a network link show half the hosts as dead. If you lose cross-DC connectivity, how will you ever know what really happened in that DC when it comes back?
This does present some small annoyances, for example we needed to come up with a solution for aggregating status together into one place. We use Nagdash for that. It uses the nagios-api, which I’ll come onto more later. We also use nagios-api to allow us to downtime hosts quickly and easily via irccat in IRC, regardless of the datacenter.
![]()
We’ve done the same with Ganglia and FITB too, for the same reasons. Much easier to scale things by adding more boxes, once you get over the hurdles of managing multiple instances. As long as you’re using configuration management.
“Second most horrible configuration”
After sendmail. Fair enough… m4 anyone? Some people like it though, it’s called preference.
Anyway, those are some strong feelings. Ever used XML based configuration? ini files? Yaml? Hadoop? In *my opinion* they’re worse. Maybe you’re a fan.
Regardless, if you spend your day picking through Nagios config files, then you probably either love it anyway, you’re doing a huge rewrite of your old config, or you’re probably doing it wrong. You can easily automate this.
We came up with a pretty simple solution for the split NRPE/Nagios configs thing at Etsy: Stop worrying about the NRPE configs and put every check on every host. The entire directory is 3MB, and does it matter if you have a check on a system you never use? No. Now you only have one config to worry about.
Andy acknowledges Chef/Puppet automation later where he calls using them to manage your Nagios configuration a “band aid”. Is managing your Apache config a “band aid”? How about your resolv.conf? Depending on your philosophy, you could basically call configuration management in general a giant bandaid. Is that a bad thing? No! That’s what makes it awesome. Our jobs is tying together components to construct a functioning system, at many many levels. At the highest level, at Etsy we’re here to make a shopping website. There are a bunch more systems tied together to make that possible lower down.
This is actually the Unix philosophy. Many small parts, applications that do a small specific thing, which you tie together using “|”. A pipe. You pipe data in to one application, and you manipulate it how you want on the way out. Which brings me onto:
“No programmatic interfaces”
At this point I am threatened with “If I catch you parsing status.dat I will beat your ass”. Bring it on!
We’re using the wonderful nagios-api project extremely heavily at Etsy because it provides a fantastic REST API for anything you’ve ever wanted in Nagios. And it does so by parsing status.dat. So sue me. Call me crazy, but isn’t parsing one machine readable output into another machine readable output basically computers? Where exactly is the issue in that?
Not only that, but it works really really well. We’ve contributed bits back to extend the functionality, and now our entire day to day workflow depends on it.
Would it be cool if it was built in? Maybe. Does it matter that it’s not? No. Again, pipes people. We’re using Chef as “echo” into Nagios, and then piping Nagios output into nagios-api for the output.
“Horrendous interface”
Well, it’s more “old” than anything else. At least everything is in the same place as you left it because it’s been the same since 1912. I wouldn’t argue if it was modernised slightly.
“Stupid wire format for clients”
I don’t think I’ve ever looked. Why are you looking? When was the last time NRPE broke? Maybe you have a good reason. I don’t.
“Throws away perfdata”
Again with the pipes! As Nagios logs this, we throw it into Splunk and Logstash. I admit we don’t bother doing much with it from there, as I like my graphs powered by something that was designed to graph, but a couple of times I’ve parsed the perfdata output in one of those two to get data I need.
All singing all dancing!
In the end though, I think the theme we’re coming onto here is that Andy really wants a big monolithic thing to handle everything for him, whereas actually I’m a massive fan of using the right tool for the job. You can buy a clock radio that is also a iPod dock, mp3 player, torch, battery charger, cheese grater, but it does all those things terribly.
For example, I don’t often need the perfdata because we have Ganglia for system level metrics, Graphite for our app level metrics, and we alert on data from both of those using Nagios.
In the end, Nagios is an extremely stable, extremely customisable piece of software, which does the job of scheduling and running shell scripts and then taking that and running other shell scripts to tell someone about it incredibly well. No it doesn’t do everything. Is that a bad thing?
Murphy said this excellently:
“Sensu has so many moving parts that I wouldn’t be able to sleep at night unless I set up a Nagios instance to make sure they were all running.”
(As a side note, yes all of our Nagios instances monitor each other, no they’ve never crashed)
I will be honest; I haven’t used Sensu, because I’m in a happy place right now, but just the architectural diagram of how it works scares the shit out of me. When you need 7 arrow colours to describe where data is going in a monitoring system, I’m starting to fear it slightly. But hey, if it works, good on you guys. It just looks a lot like this. Nothing wrong with that, if you can make it stable and reliable.
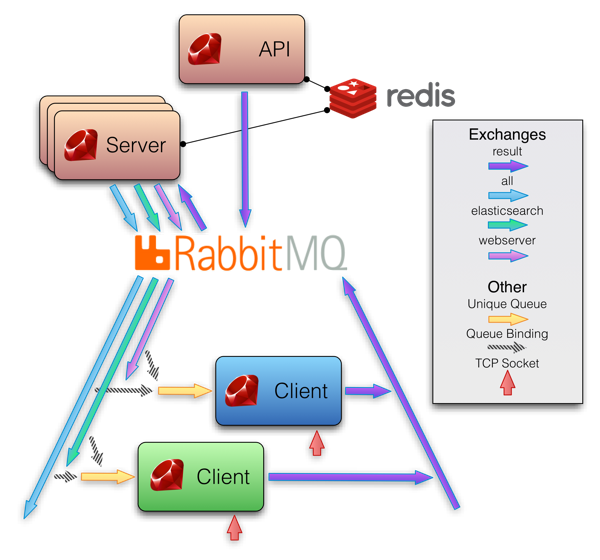
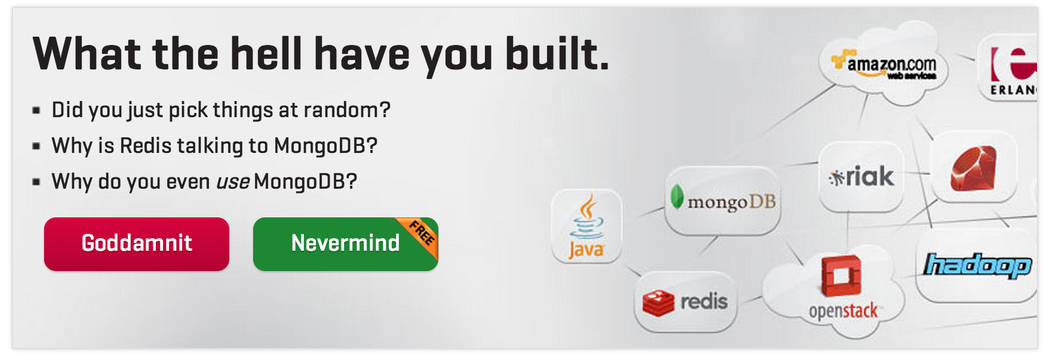
Your mileage may vary
The nice thing about this world is people have choices. You may read everything I just wrote and still think Nagios is rubbish. No problem!
Certainly for us, things are working out pretty great, so Nagios will be with us for some time (drama involving monitoring plugins aside…). When we’ve hit a limit, that’ll be the next thing out the window or re-worked. But for now, long live Nagios. And it’s far from being on life support.
And, the best thing is, that doesn’t even stop Andy making something awesome. Hell, if it’s really good, maybe we’ll use it and contribute to it. But declaring Nagios as dead isn’t going to help that effort, actually. It will just alienate people. But I’m sure there are many of you who are sick of it, so please, don’t let us stop you.
Follow me on Twitter: @lozzd
Just use mk_livestatus to inspect the *in memory* state of a nagios instance, bye bye status.dat parsing!
http://mathias-kettner.de/checkmk_livestatus.html
There are several web UIs that can work with livestatus with multiple nagios instances.
Well, Andy made the points but he also missed the boat.
I for once will continue using Icinga but instead of manually editing the config files I will let Check_MK does the dirty jobs for me. Nagios/Icinga/Shinken can use Check_MK and it does not matter whether you are in the cloud or in the data center, you can find a way to create an entry for a host and drop that file in Check_MK, do the inventory, and reload Icinga. Certainly this will work for some shops if you can add a few additional tools but just to set up a monitoring system and you have to have another MQ and other components can be intimidated and problematic. KISS so when things actually fail, you can understand and besides that you can sleep at night with less moving parts.
Having just rolled out a new Nagios installation – wouldn’t do it any other way 🙂
Awesome post Laurie!
Honestly you should try check_mk and OMD. It really is so much better than standard nagios.
Why isn’t use_large_installation_tweaks on by default!?
Because it also disable environnement_macros (all NAGIOS_ variables), and lot of notification scripts are using them (but should not…)
+1 for check_mk. It was ahead of its time for DRY, centralization, scaling, and OPS as Code. It has just been sitting there waiting for the world to catch up.
Further, you don’t really have to parse status.dat if you don’t want to. I don’t know why more people don’t make use of the event_broker interface. You can expose pretty much anything you want in just about any way you want with that.
I think the argument against letting Nagios die isn’t that is bad at what it does. The problem is that the what it does isn’t what we can (and should) be doing and the “Nagios mentality” holds us all back.
Reading telemetry off systems and providing deep insight into their behavior is what we need from the operations side. That is a broad task that requires analytics on the data collected. Nagios and the myriad products designed like Nagios simply do not allow for this approach. There are systems today that do this. I like to think we have one of them in Circonus.
In buzzword terms, monitoring is now a “big data” and/or a “data science” problem. Tools like Nagios don’t allow engineers to approach the problem for what it has become. It solves the “is it up?” questions and distracts engineers from the “is it behaving well?” questions.
Let Nagios die. Not because it sucks, but so that we can all move on to the problems that deserve our attention and advance the state of the art.
Sure I’m biased… but I’m also right.
I’ll admit I last looked at Nagios some 10 years ago and didn’t love it even back then. I remember thinking it all looked like a big hack, but maybe that was some old version of Nagios back them.
What Theo wrote is right, though, and it shows in the above post. Like Theo, I’m biased because of SPM – performance monitoring service, however …. in this post there is a complaint about Sensu and the number of arrows in one of the Sensu diagrams, but the post talks about Nagios and Ganglia and Logstash and Splunk, and I know there is also Elasticsearch and Kibana and NewRelic at Etsy. That’s a LOT of tools! Nagios provides only the basic info a devops needs, AFAIK, or at least I think most people use it purely for alerting. Once you get an alert you need to look at graphs, you need to peek at the logs, you need to check events, etc. and, I think, there are more comprehensive tools today that provide all that, so why not use them?
Theo > “Reading telemetry off systems and providing deep insight into their behavior is what we need from the operations side. ”
That does not sound like any kind of significant step in evolution. In fact it seems more like a debate on which is the best canvas for scribbling observations on: cave wall or urban street wall.
I am not sure why the industry is stuck in such prehistoric thinking, that has somehow carried over with our ability to invents tools that write data on some medium.
I suspect this has largely to do with our thinking that man it as the center of the universe including one that is digital and operates on an entirely different scale that we can humanly operate at. Or maybe it is because the people that build or use such tools simply have not understanding of software or want to simply view every unique incarnation as a black box because it makes it seem they are in control, when it could not be further from the truth.
If we really want to control, manage and influence software systems then we must delegate far more to machines and not just other supervisor machines but the very machines that we wish to monitor. Software needs to be self aware (mindfulness), self regulated, self adaptive and have an ability to self replicate its execution behavior across time and space. This is not as crazy as it might initially sound. The ability to simulate, signal and stimulate is already available today. The problem is that such change in course will meet significant resistance from those still held up in a cave of sorts looking outwards at the world and relaying information further back into the black abyss.
We desperately need a rethink but not by those not writing software.
http://www.jinspired.com/site/mirroring-mindreading-and-simulation-of-the-java-virtual-machine
http://www.jinspired.com/site/going-beyond-actor-process-supervision-with-simulation-signaling
http://www.jinspired.com/site/the-new-apm
Nice response, but you’re actually making the same mistake as @supersheep
Yeah, that Gearman thing freaks me out too. I don’t think I’d want to use it,
Why not supporting this statement with technical reasoning? We’re all engineers here.
I’ve been using Nagios and more recently Icinga for a long time and recently decided to see what else was out there. I evaluated a lot of other apps, none of them did what I wanted. I looked at the commercial Nagios versions (Nagios XI, Groundworks, Opsview, Op5, etc) and I looked at other open source monitoring solutions (Zabbix, Zenoss, OpenNMS, Hyperic, PandoraFMS, etc) and nothing compared with good old open source Icinga. Has an updated interface, gives me the flexibility of Nagios to monitor how I want and as long as I start out with a logical format to how I manage my files (I’ve gotten this down pretty good), then I don’t have any issues with Icinga.
That’s because you haven’t tried OMD (Check_MK + Nagios + PNP4Nagios + Nagvis) yet. I have also looked at all those other tools you mentioned about and have tried Icinga. But Icinga still suffers from the same configuration hell as Nagios itself. Check_MK has resolved a lot of bottlenecks of Nagios and gave it a new life. Check out my post here.
http://blog.unicsolution.com/2013/11/best-monitoring-solution-omd-nagios.html
Actually, it gets boring to get those bi-quarterly posts by #big #influencer #professionals at some Web startup or analyst firm telling us how dated Nagios is based on their use of (plain, shitty, dated) Nagios alone.
The Nagios _Ecosystem_ has moved on.
What these guys write code for or write rants about are things that last mattered in early 2009. You know, like before Github even was a thing.
Ever since the Icinga fork things have stayed in motion, and since Check_MK came around noone needs to look back or worry about if or why Nagios configuration doesn’t look nice.
Unless you work with some place that pushes against modern software you have no reason to stick with “Nagios” of 2008.
And if that’s where you’re knowledge stops, then just shut up and get training.
(No, this is not a commercial, I don’t do them any more. I’m really just so pissed off)
I think you’re missing the point here: Nagios needs to die because it gets the fundamental concept of monitoring flat out wrong. It’s not about what you know about to check — it’s about what you don’t and gathering as much data as you can before the failure so that you can better understand why things went south in the first place.
Nagios’ fundamental problem is that it’s about what you know to check for. You rely upon writing/enabling/configuring checks for every single possible failure, and most of the time the data over time is thrown away or otherwise fragmented in such a pervasive way that it’s nearly impossible to correlate.
“We “only” have 10,000 checks in our primary datacenter, all active, usually on 2-3 minute check intervals with a bunch on 30 seconds”
What about the million other indicators of problems that you don’t check for? How about request rates going to and from various services in your infrastructure? Can you correlate that with memory pressure and paging quickly and easily? What about that rack of machines with GPUs in them that you use for heavy numeric computations? Can you correlate GPU loads with UPS-reported power usage to determine if there was a failure because of a brownout due to a spike in GPU load? These aren’t just hypothetical cases — the majority of our “ghost” issues and “heisenbugs” are mystifying simply because we have no knowledge of what a machine/service/whatever is doing.
Just checking to see if a service is “up” isn’t enough, and polling for individual checks is insanity leftover from an age when we had 10-20 machines per sysadmin, each a beautiful little snowflake doing one job and doing it well. Even graphing tools like Ganglia miss the mark: you get a graph of a short period, and it’s localized per machine. This kind of mindset tells you exactly one thing: the service is up or down, but it doesn’t give you anything useful for the main component of our jobs: root cause analysis.
I think many of the replies have a kernal of truth to them. It also illustrates how unique each place of work is in terms of their monitoring needs. My view is that there are 2 needs that neeed to be met. FIrst, there is the traditional monitoring if you will. We need to know if a device is up or down. The services we monitor are critical to keeping the buisiness running. Many times these alerts will keeps us from an outage. When there is an outage, our appoach is to determine what we need to enhance to our monitoring infrastructure to prevent that outage. Hence our Nagios installation is constantly evolving and learning. This represents the first level of defence. Now root cause analysis is the second level. That is when you take all the data you have been collecting from logs and such and you use a tool like logstash or splunk to do your analysis. This is equally important because this is where you will learn how to prevent a reoccurance and that gets funnelled back into your monitoring system. What good does it do to have the analytics side evaluating millions of events and log data while the business sits idle waiting for the application to come back. Maybe I am missing something but I feel you need both. For us Nagios is more than filling the bill with monitoring and alerting. It’s flexible enough that we can continue to enhance our ability to prevent outages. We are also begining to implement the second level that some of the engineers here have spoken about. This is where we will be doing our root cause analysis and then taking what we have learned and putting it into our monitoring system. So we need both.
Hi,
I read with interest your comments. We are migrating to a fully {or nearly} virtualized environment on Vmware resembling a private cloud but wihout the bells and whistles. we have nagios in place plus SCOM plus cricket and more. Basically i inherited a mess. I am being asked to propose a strategy forward. Any experiences with Hyperic on Vmware ?
@june is right about Nagios.
There are other tools out there that can automatically discover things about your server, and measure/monitor them without constant human tickling. Caveat: most cost money
Nagios costs money as well – HUGE man-hours to get it working on more than 100 systems. Sure, automation will help lower that per-host cost over time but the initial work (and getting it all right the first time ain’t happening) will mean the ROI is in multiple years. Years you could be devopping (made that up), or even taking a vacation.
Also, check out pynag:
http://pynag.org/
Nagios is the best — if you know what you’re doing. In my experience people that don’t like Nagios just don’t know how to use it or configure it effectively. It’s too complicated for them because the vast freedom of customization requires effort and choices. Oh sure… there’s a boat load of “monitoring” services and applications out there, all prettied up with flashy GUIs of one-click, one window, plug ‘n’ play wonders, with an OSX /iPhone app to boot — but none of them come close to having the versatility and customization that Nagios does. They call the main component “Nagios Core” for a reason. You can monitoring anything from a toaster to a satellite and you can format and funnel that data into anything — if you know what you’re doing. Just my opinion.
Huge +1 to CW’s comment. Huge. Nagios Core is phenomenal *because of* it’s versatility. Learn how it works. Learn how to pipe your output. Learn how to take input. Use the API. The consumerization of IT has been great as a way to make IT more accessible and highlighting the difference between IT Pro’s from the point-and-click world, and those who are ready for true DevOps. IMO, Nagios is a perfect DevOps tool because of it’s configurability and IO capabilities.
HUGE +1 to check_mk. Huge.
Cw gets it right. If you know Nagios, you can make it dance.
We threw out Tivoli and replaced it with Nagios, we monitor 1500 servers and over 15,000 checks.
We use the standard checks, custom plugins we wrote ourself and a mixture of active and passive checks that alert us when we have probs with our trading platform.
It works, its simple, the ops guys know what to do. We display our alerts in Nagstamon that runs on everyone’s screen. Using Role based access control only the people who need the alerts see them.
I have used Nagios since 1999 when it was Netsaint and have seen many Young Pretenders come and go in that time. Everyone poo-poo’s Nagios because its the one that gets teh job done.
Im not sure what Mike is doing but our ROI was delivered in less than 6 months. Getting rid of the 80K Tivoli “Consultant” who was monitoring 200 hosts and 300 services was a good start.
Hello,
I’m not sure this is the right place to discuss about that, but I have a question.
I use Nagios for about 2,500 hosts and 10,000 services. I plan to move from Nagios to Zabbix for different reasons… My question is concerning the Nagios status.dat file. Currently, I use the status.dat file to regularly parse it and gather information contained in to feed a third application with. Is there an equivalent file created regularly in Zabbix which I could use to do the same thing ?
Zabbix comes with very rich API that can be used to retrieve configuration and history data for one or two-way replication with 3rd party systems (configuration management, ticketing, etc).
Note everyone has the money to have a Tivoli consultant around.
You migrated from one of the most expensive systems into an open-source base – you have ROI.
Most people are not converting a ‘lots of zeros’ environment to something that just takes man-hours. Most people are converting man-hours into a solution and I cannot say that Nagios is really where I would spend my man-hours.
I still believe there are other, better solutions but they cost money. That money *may* be less than buying another commercial system. I found that Nagios cost more than the solution that was rolled out because of said man-hours. And I was a Nagios user from the Netsaint days then through versions 1-3. I have not touched version 4 at this time but I will when time permits.
I manage and use OMD (check_mk) at work. We have a service contract and let me tell you.. It gets more and more awesome by the day.
Well, Parsing status.dat is very important and necessary for nagios admin to get sense of current status. so combine it with nagios.cmd you can write an API or external tool. I did something like https://github.com/cxfcxf/nagios_control to control multiple servers by regex what nagios itself lack of. But the status.dat is updated in certain interval which is not fast enough to present very current nagios status so that the plugin like https://github.com/cxfcxf/pd-nagios-connector will not trigger double acknowledge to nagios.cmd.
Overall, i like the customization part of nagios and the fact that you dont have to pay for it as long as you have someone who can do external development on it and make it work for you. for constant metric, you can always build metric and send it to program like graphite to do the data retention and graph it
wow, awesome blog article.Much thanks again. Great.
Greetings! Quick question that’s entirely off topic.
Do you know how to make your site mobile friendly? My weblog looks weird when browsing from my apple
iphone. I’m trying to find a theme or plugin that might be able to resolve
this problem. If you have any suggestions, please
share. Many thanks!
I used to work at a CDN where I wrote “meta” nagios checks. These were active nagios checks that would comb all of the rrd data collected by pnp4nagios and analyze it. It would detect anomalies and alert on those. It was really good at sniffing out underlying problems other than the “Is the service running” type. Nagios can be used for higher level analysis if you know what you are doing.
That said, OMD/check_mk rocks. I’ve toyed with a bunch of monitoring systems, but OMD/check_mk is hands down the smartest and easiest to use. It isn’t perfect, but when you like to gather data like I do it is a breath of fresh air.
Setting up OMD check_mk for 1200 hosts… It is so intuitive, easy and fun to work with. no more standard nagios or icinga for me…
I just came across this article, thanks for your insight. I’m a long-time fan of Nagios and yes it can scale quite well.
I’ve recently written an Ansible playbook that will fully template and generate all your configs, host checks and services without needing to touch any configuration files.
If anyone else can find use for this it’s located here:
https://github.com/sadsfae/ansible-nagios
I’ve put together a guide and video here:
https://hobo.house/2016/06/24/automate-nagios-deployment-with-ansible/
There’s a push from some folks where I work to move to Sensu but I don’t see any reason when Nagios works. If you can pull a dynamic inventory from Foreman it’s even completely automated.