SSDs: A gift and a curse

Artur Bergman, founder of a CDN exclusively powered by super fast SSDs, has made many compelling cases over the years to use them. He was definitely ahead of the curve here, but he’s right. Nowadays, they’re denser, 100x faster and as competitively priced as hard disks in most server configurations.

At Etsy, we’ve been trying to get on this bandwagon for the last 5 years too. It’s got a lot better value for money in the last year, so we’ve gone from “dipping our toes in the water” to “ORDER EVERYTHING WITH SSDs!” pretty rapidly.

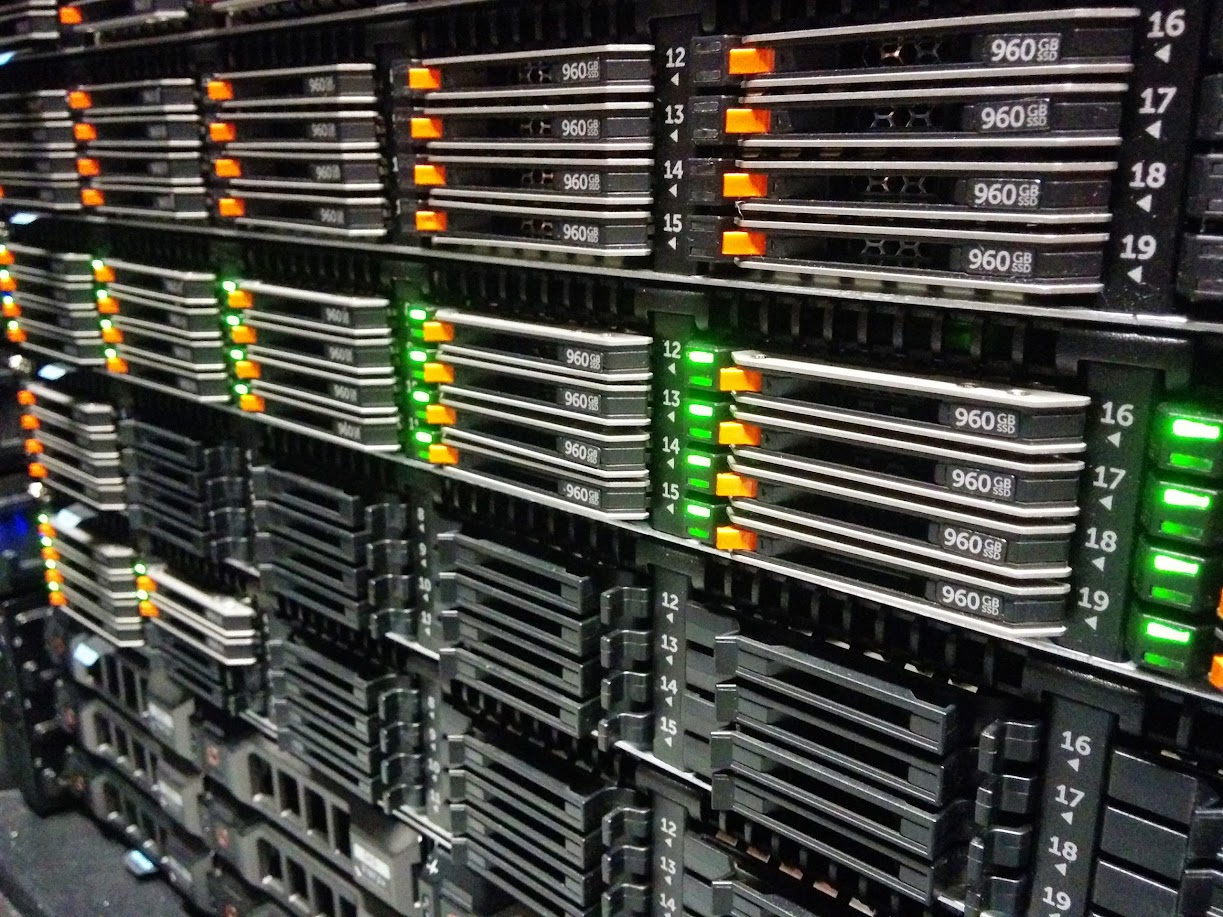
This isn’t a post about how great SSDs are though: Seriously, they’re amazing. The new Dell R630 allows for 24x 960GB 1.8″ SSDs in a 1U chassis. That’s 19TB usable ludicrously fast, sub millisecond latency storage after RAID6, that will blow away anything you can get on spinning rust, use less power, and is actually reasonably priced per GB.

Picture of Dell R630, 24x 960GB SSDs in 1U chassis
Plus, they look amazing.

So if this post isn’t “GO BUY ALL THE SSDs NOW”, what is it? Well, it’s a cautionary tale that it’s not all unicorns and IOPs.

The problem(s) with SSDs

When SSDs first started to come out, people were concerned that these drives “only” handled a certain number of operations or data during their lifetime, and they’d be changing SSDs far more frequently than conventional spinning rust. Actually, that’s totally not the case and we haven’t experienced that at all. We have thousands of SSDs, and we’ve lost maybe one or two to old age, and it probably wasn’t wear related.

Spoiler alert: SSD firmware is buggy

When was the last time your hard disk failed because the firmware did something whacky? Well, Seagate had a pretty famous case back in 2009 where the drives may not ever power on again if you power them off. Whoops.

But the majority of times, the issue is the physical hardware… The infamous “spinning rust” that is in the drive.

So, SSDs solve this forever right? No moving parts.. Measured mean time to failure of hundreds of years before the memory wears out? Perfect!

Here’s the run down of the firmware issues we’ve had over 5 or so years:

Intel

Okay, bad start, we’ve actually had no issues with Intel. This seems to be common across other companies we’ve spoken to. We started putting single 160GB in our web servers about 4 years ago, because it gave us low power, fast, reliable storage and the space requirements for web servers and utility boxes was low anyway. No more waiting for the metal to seize up! We have SSDs that have long outlived the servers.

OCZ

Outside of the 160GB Intel drives, our search (Solr) stack was the first to benefit from denser, fast storage. Search indexes were getting big; too big for memory. In addition, getting them off disk and serving search results to users was limited by the random disk latency.

Rather than many expensive, relatively fast but low capacity spinning rust drives in a RAID array, we opted for OCZ Talos 960GB disks. These weren’t too bad; we had a spate of initial failures in what seemed like a bad batch, but we were able to learn from this and make the app more resilient to failures.

However, they had poor SMART info (none) so predicting failures was hard.

Unfortunately, the company later went bankrupt, and Toshiba rescued them from the dead. They were unavailable for long enough that we simply ditched them and moved on.

HP SSDs

We briefly tried running third party SSDs on our older (HP) Graphite boxes… This was a quick, fairly cheap win as it got us a tonne of performance for relatively little money (back then we needed much less Graphite storage). This worked fine until the drives started to fail.

Unfortunately, HP have proprietary RAID controllers, and they don’t support SMART. Or rather, they refuse to talk to non-HP drives using off the shelf technology, they have their own methods.

Slot an unsupported disk or SSD into the controller, and you have no idea how that drive is performing or failing. We quickly learnt this after running for a while on these boxes, and performance randomly tanked. The SSDs underlying the RAID array seemed to be dying and slowing down, and we had no way of knowing which one (or ones), or how to fix it. Presumably the drives were not being issued TRIM commands either.

When we had to purchase a new box for our primary database this left us with no choice: We have to pay HP for SSDs. 960GB SSDs direct from HP, properly supported, cost us around $7000 each. Yes, each. We had to buy 4 of them to get the storage we needed.

On the upside, they do have fancy detailed stats (like wear levelling) exposed via the controller and ILO, and none have failed yet almost 3 years on (in fact, they’re all showing 99% health). You get what you pay for, luckily.

Samsung

Samsung saved the day and picked up from OCZ with a ludicrously cheap 960GB offering, the 840 EVO. A consumer drive, so very limited warranty, but for the price (~$400-500) you got great IOPS and they were reliable. They had better SMART info, and seemed to play nicely with our hardware.

We have a lot of these drives:

[~/chef-repo (master)] $ knife search node block_device_sda_model:'Samsung' -a block_device.sda.model

117 items found

That’s 117 hosts with those drives, most of them have 6 each, and doesn’t include hosts that have them behind RAID controllers (for example, our Graphite boxes). In particular, they’ve been awesome for our ELK logging cluster

Then BB6Q happened…

I hinted that we used these for Graphite. They worked great! Who wouldn’t want thousands and thousands of IOPs for relatively little money? Buying SSDs from OEMs is still expensive, and they give you those darn fancy “enterprise” level drives. Pfft. Redundancy at the app level, right?

We had started buying Dell, who use a rebranded LSI RAID controller so they happily talked to the drives including providing full SMART info. We had 16 of those Samsung drives behind the Dell controller giving us 7.3TB of super fast storage.

Given the already proven pattern, we ordered the same spec box for a Ganglia hardware refresh. And they didn’t work. The RAID controller hung on startup trying to initialise the drives, so long that the Boot ROM was never loaded so it was impossible to boot from an array created using them.

What had changed?! A quick

"MegaCli -AdpAllInfo -a0 | diff"

on the two boxes, revealed: The firmware on the drive had changed. (shout out to those of you who know the MegaCli parameters by heart now…)

Weeks of debugging and back and forth with both Dell (who were very nice given these drives were unsupported) and Samsung revealed there were definitely firmware issues with this particular BB6Q release.

It was soon released publicly, that not only did this new firmware somehow break compatibility with Dell RAID controllers (by accident), but they also had a crippling performance bug… They got slower and slower over time, because they had messed up their block allocation algorithm.

In the end, behind LSI controllers, it was the controller sending particular ATA commands to the drives that would make them hang and not respond.. And so the RAID controller would have to wait for it to time out.

Samsung put out a firmware updater and “fixer” tool for this, but it needed to move your data around so only ran on Windows with NTFS.

With hundreds of these things that are in production and working, but have a crippling performance issue, we had to figure out how they would get flashed. An awesome contractor for Samsung agreed that if we drove over batches of drives (luckily, they are incredibly close to our datacenter) they would flash them and return them the next day.

This story has a relatively happy ending then; our drives are getting fixed, and we’re still buying their drives; now the 960GB 850 PRO model, as they remain a great value for money high performance drive.

Talking with other companies, we’re not alone with Samsung issues like this, even the 840 PRO has some issues that require hard power cycles to fix. But the price is hard to beat, especially now the 850 range is looking more solid.

LiteOn

LiteOn were famously known for making CD writers back when CD writers were new and exciting.

But they’re also a chosen OEM partner of Dell’s for their official “value” SSDs. Value is a relative term here, but they’re infinitely cheaper than HP’s offerings, enterprise level, fully supported and for all that, “only” twice the price of Samsung (~$940)

We decided to buy new SSD based database boxes, because SSDs were too hard to resist for these use cases; crazy performance and at 1TB capacity, not too much more expensive per GB than spinning rust. We had to buy many many 15,000rpm drives to even get near the performance, and they were expensive at 300GB capacity. We could spend a bit more money and save power, rack space, and get more disk space and IOPs.

For similar reasons to HP, we thought best to pay the premium for a fully supported solution, especially as Samsung had just caused all these issue with their firmware issues.

With that in mind, we ordered some R630’s hot off the production line with 960GB LiteOn’s, tested performance, and it was great: 30,000 random write IOPs across 4 SSDs in RAID6, (5.5 TB useable space).

We put them live, and they promptly blew up spectacularly. (Yes, we had a postmortem about this). The RAID controller claimed that two drives had died simultaneously, with another being reset by the adapter. Did we really get two disks to die at once?

This took months of working closely with Dell to figure out. Replacement of drives, backplane, and then the whole box, but the problem persisted. Just a few short hours of intense IO, especially on a box with only 4 SSDs would cause them to flip out. And in the mean time, we’d ordered 50+ of these boxes with varying amounts of SSDs installed, having tested so well initially.

Eventually it transpires that, like most good problems, it was a combination of many factors that caused these issues. The SSDs were having extended garbage collection periods, exacerbated by a smaller amount of SSDs with higher IO, in RAID6. This caused the controller to kick the drive out of the array… and unfortunately due to the write levelling across the drives, at least two of them were garbage collecting at the same time, destroying the array integrity.

The fix was no small deal; Dell and LiteOn together identified and fixed weaknesses in their RAID controller, the backplane and the SSD firmware. It was great to see the companies working together rather than just pointing fingers here, and the fixes for all sizes except 960GB was out within a month.

The story here continues for us though; the 960GB drive remains unsolved, as it caused more issues, and we had almost exclusively purchased those. For systems that weren’t fully loaded, Dell kindly provided us with 800GB replacements and extra drives to make up the space. For the rest, because the stress across the 22 drives means garbage collection isn’t as intense, so they remain operating until a firmware fix.

Summary

I’m hesitant to recommend any one particular brand, because I’m sure as with the hard disk phenomenon (Law where each person has their preferred brand that they’ve never had issues with but everyone else has), people’s experiences will have varied.

We should probably collect some real data on this as an industry and share it around; I’ve always been of the mindset that we’re weirdly secretive sometimes of what hardware/software we use but we should share, so if anyone wants to contribute let me know.

But: you can probably continue to buy Intel and Samsung, depending on your use case/budget, and as usual, own your own availability and add resiliency to your apps and hardware, because things always fail in ways you can’t imagine.

systemd: Using ExecStop to depool nodes for fun and profit

Preface: There is a tonne of drama about systemd on the internets; it won’t take you long to find it, if you’re curious. Despite that, I’m largely a fan and focusing on all the cool stuff I can finally do as an ops person without basically re-writing crappy bash scripts for a living (cough sys-v init) 

Process Supervision

Without going into the basics about systemd too much (I quite enjoy this post as an intro), you tell systemd to run your executable using the “ExecStart” part of the config, and it will go and run that command and make sure it keeps running. Wonderful! In this case, we wanted to keep HHVM running all the time, so we told systemd to do it, in 3 lines. Waaaay easier than sys-v init.

ExecStop

By default when you tell systemd to stop a process, and you haven’t told it how to stop the process, it’s just going to gracefully kill the process and any other processes it spawned.

However, there is also the ExecStop configuration option that will be executed before systemd kills your processes, adding a new “deactivating” step to the process. It takes any executable name (or many) as an argument, so you can abuse this to do literally anything as cleanup before your processes get killed.

Systemd will also continue to do it’s regular killing of processes if by the end of running your ExecStop script the processes are not all dead.

Load balancer health checks

We have a load balancer that uses a bunch of health checks to ensure that the node that it’s asking to do work can actually still do work before it sends it there.

One of these is hitting an HTTP endpoint we set up, let’s call it “status.php” which just contains the text “Status:OK”. This way, if the server dies, or PHP breaks, or Apache breaks, that node will be automatically depooled and we don’t serve garbage to the user. Yay!

Example: automatic depooling using ExecStop

Armed with my new ExecStop super power, I realised we were able to let the load balancer know this node was no longer available before killing the process.

I wrote a simple bash script that:

  • Moves the status.php file to status.php.disabled
  • Starts pinging the built in HHVM “load” endpoint (which tells you how many requests are in flight in HHVM) to see if the load has hit 0
  • if the curl to the “load” endpoint fails, we try again after 1 second
  • If we hit 30 seconds and the load isn’t 0 or we still can’t reach the endpoint, we just carry on anyway; something is wrong.
  • Once the load is “0”, we can continue
  • use `pidof` to kill the HHVM process
  • Move status.php.disabled back to status.php

And now, i can reference this in our HHVM systemd unit file:

[Unit]
Description=HHVM HipHop Virtual Machine (FCGI)

[Service]
Restart=always
ExecStart=/usr/bin/hhvm -c <snip>
ExecStop=/usr/local/bin/hhvm_stop.sh

Now when I call service hhvm stop, it takes 6-10 seconds for the stop to complete, because the traffic is gracefully removed.

Logging

Another thing I personally love about systemd, is the increase visibility the operator gets about what’s going on. In sys-v, if you’re lucky, someone put a “status” action in their bash script and it might tell you if the pid exists.

In systemd, you get a tonne of information about what’s going on; the processes that have been launched (including child processes), the PIDs, logs associated with that process, and in the case of something like Apache, the process can report information back:

Apache systemd status output showing requests per second

In this case, our ExecStop script output gets shown when you look at the status output of systemd:

[root@hhvm01 ~]# systemctl status hhvm -l
hhvm.service - HHVM HipHop Virtual Machine (FCGI)
   Loaded: loaded (/usr/lib/systemd/system/hhvm.service; enabled)
   Active: inactive (dead) since Tue 2015-02-17 22:00:52 UTC; 48s ago
  Process: 23889 ExecStop=/usr/local/bin/hhvm_stop.sh (code=exited, status=0/SUCCESS)
  Process: 37601 ExecStart=/usr/bin/hhvm <snip> (code=killed, signal=TERM)
  Main PID: 37601 (code=killed, signal=TERM)

Feb 17 22:00:45 hhvm01 hhvm_stop.sh[23889]: Moving status.php to status.php.disabled
Feb 17 22:00:47 hhvm01 hvm_stop.sh[23889]: Waiting another second (currently up to 8) because the load is still 16
Feb 17 22:00:48 hhvm01 hhvm_stop.sh[23889]: Waiting another second (currently up to 9) because the load is still 10
Feb 17 22:00:49 hhvm01 hhvm_stop.sh[23889]: Waiting another second (currently up to 10) because the load is still 10
Feb 17 22:00:50 hhvm01 hhvm_stop.sh[23889]: Load was 0 after 11 seconds, now we can kill HHVM.
Feb 17 22:00:50 hhvm01 hhvm_stop.sh[23889]: Killing HHVM
Feb 17 22:00:52 hhvm01 hhvm_stop.sh[23889]: Flipping status.php.disabled to status.php
Feb 17 22:00:52 hhvm01 systemd[1]: Stopped HHVM HipHop Virtual Machine (FCGI).

Now all the information about what happened during the ExecStop process is captured for debugging later! No more having no idea what happened during the shut down.

When the script is in the process of running, the systemd status output will show as “deactivating” so you know it’s still ongoing.


Summary

This is just one example of how you might use/abuse the ExecStop to do work before killing processes. Whilst this was technically possible before, IMO the ease of use and the added introspection means this is actually feasible for production systems.

I’ve gisted a copy of the script here, if you want to steal it and modify it for your own use.

Why I’ll be letting Nagios live on a bit longer, thank you very much

My my, hasn’t @supersheep stirred up a bit of controversy over Nagios over the last week?

In case you missed it, he brought up an excellent topic that’s close my heart: Nagios. In his words, we should stop using it, so we can let it die. (I read about this in DevOpsWeekly, which you should absolutely sign up to if you haven’t already, it’s fantastic)

Mr Sheep (Andy) brought up some excellent points, and when I read them I must admit getting fairly triggered and angry that someone would speak about one of my favourite things in such a horrible way! Then maybe I started thinking I had a problem. Was I blindly in love with this thing? Naive to the alternatives, a fan boy? Do I need help? Luckily I could reach out to my wonderful coworkers, and @benjammingh was quick to confirm that yes, I do need help, but then again don’t we all. That’s a separate issue.

Anyway, the folks at reddit had plenty to say about this too. Some of the answers are sane, some are… Not so. Other people were seemingly very angry too. I don’t blame them.. It’s a bold move to stand up and say a perfectly good piece of software “sucks” and “you shouldn’t use it”. Which was the intention, of course, to make us talk about it.

Now the dust has settled slightly, I’m going to tell you why I still love Nagios, and why it will be continued to be used at Etsy, addressing the points Andy brought up individually.

“Doesn’t scale at all”

Yeah, that Gearman thing freaks me out too. I don’t think I’d want to use it, even though we use Gearman extremely heavily at Etsy for the site (we even invited the creator in for our Code as Craft speaker series).

But what scale are people taking here? Is it really that hard?

We “only” have 10,000 checks in our primary datacenter, all active, usually on 2-3 minute check intervals with a bunch on 30 seconds. I’m honestly not sure if that’s impressive or embarrassing, but the machine is 80% idle, so it’s not like there isn’t overhead for more. And this isn’t a super-duper spec box by any means. In fact, it’s actually one of the oldest servers we have.

use_large_installation_tweaks

We had to enable use_large_installation_tweaks  to get the latency down, but that made absolutely no difference to our Nagios operation. Our check latency is currently 2.324 seconds.

I’m not sure how familiar people are with this flag… Our latency crept up to minutes without it, and it’s not massively well documented online that you can probably enable it with almost no effect to anything except… Making Nagios not suck quite so much.

It’s literally a “go faster” flag.

Disable CPU scaling

Our Nagios boxes are HP or Dell servers, that by default have a “dynamic” CPU scaling setting enabled. Great for power saving, but for some reason the intelligence built into this system is absolutely horrible with Nagios. Because Nagios has extremely high context switches, but relatively low CPU, it causes a lot of problems with the intelligent management. If you’re still having latency issues, set the server to “static high performance mode” or equivalent.

We’ve tested this in a bunch of other places, and the only other place it helped was syslog-ng. Normally it’s pretty smart, but there *are* a few cases that trip it up.

Horizontal Scaling

The reason we’ve ended up with 10,000 checks on that single box is because that datacenter is now full, and we’ve moved onto another one, so we’ve started scaling Nagios horizontally rather than vertically. It makes a lot more sense to have a Nagios instance in each network/datacenter location so you can get a “clean view” of what’s going on inside that datacenter rather than letting a network link show half the hosts as dead. If you lose cross-DC connectivity, how will you ever know what really happened in that DC when it comes back?

This does present some small annoyances, for example we needed to come up with a solution for aggregating status together into one place. We use Nagdash for that. It uses the nagios-api, which I’ll come onto more later. We also use nagios-api to allow us to downtime hosts quickly and easily via irccat in IRC, regardless of the datacenter.

We’ve done the same with Ganglia and FITB too, for the same reasons. Much easier to scale things by adding more boxes, once you get over the hurdles of managing multiple instances. As long as you’re using configuration management.

“Second most horrible configuration”

After sendmail. Fair enough… m4 anyone? Some people like it though, it’s called preference.

Anyway, those are some strong feelings. Ever used XML based configuration? ini files? Yaml? Hadoop? In *my opinion* they’re worse. Maybe you’re a fan.

Regardless, if you spend your day picking through Nagios config files, then you probably either love it anyway, you’re doing a huge rewrite of your old config, or you’re probably doing it wrong. You can easily automate this.

We came up with a pretty simple solution for the split NRPE/Nagios configs thing at Etsy: Stop worrying about the NRPE configs and put every check on every host. The entire directory is 3MB, and does it matter if you have a check on a system you never use? No. Now you only have one config to worry about.

Andy acknowledges Chef/Puppet automation later where he calls using them to manage your Nagios configuration a “band aid”. Is managing your Apache config a “band aid”? How about your resolv.conf? Depending on your philosophy, you could basically call configuration management in general a giant bandaid. Is that a bad thing? No! That’s what makes it awesome. Our jobs is tying together components to construct a functioning system, at many many levels. At the highest level, at Etsy we’re here to make a shopping website. There are a bunch more systems tied together to make that possible lower down.

This is actually the Unix philosophy. Many small parts, applications that do a small specific thing, which you tie together using “|”. A pipe. You pipe data in to one application, and you manipulate it how you want on the way out. Which brings me onto:

“No programmatic interfaces”

At this point I am threatened with “If I catch you parsing status.dat I will beat your ass”. Bring it on!

We’re using the wonderful nagios-api project extremely heavily at Etsy because it provides a fantastic REST API for anything you’ve ever wanted in Nagios. And it does so by parsing status.dat. So sue me. Call me crazy, but isn’t parsing one machine readable output into another machine readable output basically computers? Where exactly is the issue in that?

Not only that, but it works really really well. We’ve contributed bits back to extend the functionality, and now our entire day to day workflow depends on it.

Would it be cool if it was built in? Maybe. Does it matter that it’s not? No. Again, pipes people. We’re using Chef as “echo” into Nagios, and then piping Nagios output into nagios-api for the output.

“Horrendous interface”

Well, it’s more “old” than anything else. At least everything is in the same place as you left it because it’s been the same since 1912. I wouldn’t argue if it was modernised slightly.

“Stupid wire format for clients”

I don’t think I’ve ever looked. Why are you looking? When was the last time NRPE broke? Maybe you have a good reason. I don’t.

“Throws away perfdata”

Again with the pipes! As Nagios logs this, we throw it into Splunk and Logstash. I admit we don’t bother doing much with it from there, as I like my graphs powered by something that was designed to graph, but a couple of times I’ve parsed the perfdata output in one of those two to get data I need.

All singing all dancing!

In the end though, I think the theme we’re coming onto here is that Andy really wants a big monolithic thing to handle everything for him, whereas actually I’m a massive fan of using the right tool for the job. You can buy a clock radio that is also a iPod dock, mp3 player, torch, battery charger, cheese grater, but it does all those things terribly.

For example, I don’t often need the perfdata because we have Ganglia for system level metrics, Graphite for our app level metrics, and we alert on data from both of those using Nagios.

In the end, Nagios is an extremely stable, extremely customisable piece of software, which does the job of scheduling and running shell scripts and then taking that and running other shell scripts to tell someone about it incredibly well. No it doesn’t do everything. Is that a bad thing?

Murphy said this excellently:

“Sensu has so many moving parts that I wouldn’t be able to sleep at night unless I set up a Nagios instance to make sure they were all running.”

(As a side note, yes all of our Nagios instances monitor each other, no they’ve never crashed)

I will be honest; I haven’t used Sensu, because I’m in a happy place right now, but just the architectural diagram of how it works scares the shit out of me. When you need 7 arrow colours to describe where data is going in a monitoring system, I’m starting to fear it slightly. But hey, if it works, good on you guys. It just looks a lot like this. Nothing wrong with that, if you can make it stable and reliable.

Your mileage may vary

The nice thing about this world is people have choices. You may read everything I just wrote and still think Nagios is rubbish. No problem!

Certainly for us, things are working out pretty great, so Nagios will be with us for some time (drama involving monitoring plugins aside…). When we’ve hit a limit, that’ll be the next thing out the window or re-worked. But for now, long live Nagios. And it’s far from being on life support.

And, the best thing is, that doesn’t even stop Andy making something awesome. Hell, if it’s really good, maybe we’ll use it and contribute to it. But declaring Nagios as dead isn’t going to help that effort, actually. It will just alienate people. But I’m sure there are many of you who are sick of it, so please, don’t let us stop you.

Follow me on Twitter: @lozzd

Easy image sharing on OS X using Scrup

Nowadays, people are really into this whole “Skitch” thing, and being able to send images/screenshots to each other quickly. I’d been doing the same thing with TinyGrab for a long time, but I like to host things myself. Yes, TinyGrab has the ability to upload to your own server… but it uses FTP. This was causing me no end of issues, so I sought out something else.

I found Scrup, and I’ve been using it for the last year or so very happily. It’s open source, and has been hanging around on Github for 2 years now. There are some pretty sweet forks of it, including one that has support for a sound on upload completion, and Growl notifications too.

What does Scrup do?

So, you need to share an image, or a screenshot really quickly? Using the standard OS X screenshot features (Command + Shift + 4, and so on), you can hit one button and upload the image to your webserver and put the link to it into your clipboard ready for pasting anywhere.

It does also have the ability to edit the screenshot pre-upload (such as adding arrows to point to important, or awesome things)

What you need

  • A server somewhere with some disk space
  • PHP 5
  • A webserver

How?

  1. Install the Scrup.app onto your Mac. I have a pre-compiled a version with the sound and Growl patch included. You don’t have to use mine, you can compile it yourself using Xcode if you wish. (The source is on github here: https://github.com/rsms/scrup)
  2. Create a folder on your webserver that you want to store your images in. I call mine “grb” (short for “grab”) because I like short URLs. (/var/www/grb/ -> http://laur.ie/grb/)
  3. In that folder, put a script that will receive the files, and then return the URL to where it stored the file. You can view the one I use here (modified from the one that ships with Scrup) which names files something like “1s-euobfpq1xcwos.png” and has no authentication (so make sure you go the security-by-obscurity route of naming the script something random or add auth yourself)
  4. Open Scrup, and point it at your upload script. For example, http://yourhost/grb/receiver.php?name={filename}
  5. Take screenshots! They should get uploaded and you should see a green tick in the menu bar. The URL of the uploaded image should also be in your clipboard, ready for pasting wherever.

The best thing about Scrup is that it has a simple, fast UI for just uploading things quickly, and because it uses a regular HTTP POST, it works on whatever weird internet connection you may be on.


timeout waiting for input from local during Draining Input

I experienced this today, very frustrating; sendmail all locked up and outputting this bizarre “timeout waiting for input from local during Draining Input” error into the logs.

tl;dr: figure out what sendmail is waiting for.

In my case, it was stuck on procmail. But why? Turns out the local mailbox (a user that runs a lot of crons) had hit 3GB, at which point it didn’t seem to be accepting any more email into that inbox. Moving that file out of the way and allowing a new one to be created caused the queue to be flushed instantly.

PagerdutyPHP: Scripts for the Pagerduty API

As much as most of us would love to not have to do it, most people reading this now will have to be on call at some point. It sucks, but Pagerduty makes it a little easier to manage when your team starts to grow.

Whilst we still have Nagios sending to all contacts directly (a personal preference) we still rely on Pagerduty for emergency pages from the rest of the company, and to arrange who is on call when (their calendar is pretty good for us, allows for exceptions etc).

We’re also a user of the IRC bot “irccat” which, briefly explained, allows input/output to scripts from an IRC chat.

I wanted to combine the two for a long time, and when Pagerduty released their API to access schedule data it wasn’t long before we had a command that allows anyone in the company to ask irccat who is on call and until when.

I’ve finally got around to releasing this today, a “library” of useful Pagerduty API functions (pagerduty.php) (note currently it has just two, to see who is on call for a given schedule. Pull requests for additional useful functions please!) and more importantly, pagerdutycron.php – A script to run on an interval that will then either broadcast in IRC a new person on call, and/or send an email.

As usual, I’ve stuck the code on Github: https://github.com/lozzd/PagerdutyPHP

Hadoop and Ganglia 3.1

A quick note to anyone setting up a new Hadoop cluster and hoping to quickly use the built in Ganglia metrics collection (which you should! If it moves, graph it!): This works out of the box with Ganglia 3.0, but the protocol changed with Ganglia 3.1.

The official GangliaMetrics pages talks about this, and talks about patching (which is already available if you use the Cloudera releases) but doesn’t go into more detail than that. I recently set up a new cluster, and remembered there was something I had to change in the default config to make it work out of the box… After inquiring (and finding the comment I left in my old config file!) I remembered, you must change the default class to have “31” (e.g. Ganglia 3.1) on the end.

For example, the default config file: (Replacing @GANGLIA@ with your multicast address)

dfs.class=org.apache.hadoop.metrics.ganglia.GangliaContext
dfs.period=10
dfs.servers=@GANGLIA@:8649

mapred.class=org.apache.hadoop.metrics.ganglia.GangliaContext
mapred.period=10
mapred.servers=@GANGLIA@:8649

jvm.class=org.apache.hadoop.metrics.ganglia.GangliaContext
jvm.period=10
jvm.servers=@GANGLIA@:8649

rpc.class=org.apache.hadoop.metrics.ganglia.GangliaContext
rpc.period=10
rpc.servers=@GANGLIA@:8649

Is changed to this:

dfs.class=org.apache.hadoop.metrics.ganglia.GangliaContext31
dfs.period=10
dfs.servers=@GANGLIA@:8649

mapred.class=org.apache.hadoop.metrics.ganglia.GangliaContext31
mapred.period=10
mapred.servers=@GANGLIA@:8649

jvm.class=org.apache.hadoop.metrics.ganglia.GangliaContext31
jvm.period=10
jvm.servers=@GANGLIA@:8649

rpc.class=org.apache.hadoop.metrics.ganglia.GangliaContext31
rpc.period=10
rpc.servers=@GANGLIA@:8649

Restart the cluster, and the graphs will appear under each host in the Ganglia interface.

There is a LOT of detail in these graphs, with metrics ranging from DFS (things like bytes written, and how many operations were transferred from other nodes) to the JVM (monitor those heap memory sizes!)

This is probably old news to most people I’m sure, but I have a rule that if I didn’t find it within 30 minutes, maybe this will help someone in the same boat as me 🙂

Handy binaries for Thecus NAS boxes

I recently took delivery of the rather splendid Thecus N5500 which I love; it’s the perfect mix between “it just works” and “oh, let’s stick SSH on there and poke around”. With 5 hot swap disk shelves, and 2TB hard drives you’ve got a serious amount of storage.

For your money you get a very nice little piece of hardware in a pretty nice shell (it strikes me as a touch tacky in places but then again it’s hardly going on show) with software that gets the job done. NFS, AFP, Samba, iSCSI, iTunes DAAP support, and plenty of modules to tickle your fancy (Logitech Squeezecenter, for instance).

But who am I kidding, I’m a sysadmin. 10 minutes after powering the thing on I was dying to log in using SSH so I could watch /proc/mdstat to see the RAID build. Luckily, the modules from the Thecus N5200 work fine; which means you’re a couple of clicks away from a root terminal.

  1. Grab the SSH and SYSUSER N5200 modules, and unzip them (a mistake I made.. How embarrassing.)
  2. Upload them using the webinterface, and enable them.
  3. SSH to the NAS box using the user “sys” and the password “sys”
  4. Enjoy your shell, and remember to run `passwd sys` to change the password to something else.

Now, you’ve got yourself a pretty handy, albeit it BusyBox-ridden install of Linux. The whole point of this post, is so I can pimp a few statically compiled binaries that might come in useful to you; they did to me anyway.

(You may wish to install the UTILITIES module, which gives you a proper version of top and ps, amongst other things, available here)

You can simply untar and drop the binaries into /raid/data/modules/bin folder so that they’re in your path, and stored on your disks rather than the flash units which are rather limited in space. By the way, these modules should also work fine on the Thecus N5200 NAS boxes too.

The binaries are available here: http://denness.net/thecus/binaries/

The list includes (all the latest versions as of the date of this blog post):

  • ethtool, handy for network interface prodding
  • iftop, a very useful “GUI” app that shows incoming/outgoing network bandwidth (let’s face it, this is fun on a NAS. NOTE: you may need to execute this one using `TERM=vt100; iftop`)
  • iostat, for hard core disk stats porn. Run it with `iostat -mx 1` and watch the megabytes fly
  • rsync, particularly handy if you want to synchronise/backup data from one place to another, so particularly handy on a NAS.
  • vim, just in case you were planning on writing a lot of code on the Thecus 🙂
  • GNU screen, a nice place to store your terminals and detach and come back later. (NOTE: you may need to execute this one using `TERM=vt100; screen`)
  • The command line version of PHP, in case you were planning on writing any scripts in PHP to run on the Thecus.

Any suggestions/comments, let me know.

MonitorControls – Utilties for monitor management on Windows

When I ended up using Windows to power the overhead information screens at Last.fm, I lost the ability to have a one line crontab entry that shut the monitors into DPMS standby (and wake them up) when we’re in and out of office hours. Makes no sense wasting power, but more importantly shortening the length of screens having them on when the office is empty.

I didn’t think I would have any issue finding a utility to place the screens in to standby mode. I didn’t; but unfortunately they were either not free, massively complicated or simply didn’t work.

So I found a code snippet online, fired up a copy of Visual Studio and compiled two exe files; MonitorOn.exe and MonitorOff.exe. MonitorOff sends a signal to all attached monitors on the system to go in to sleep mode, and if you move the mouse you can wake them up as normal. Or you can run MonitorOn which will send the signal manually. Simply place these into the Windows Task Scheduler, and you have a simple, effective way to manage your information screens.

You can download MonitorOn and MonitorOff here.

Leaving Last.fm

I’ve spent 3.43 years at Last.fm, which seems almost like a lifetime. For a long time, I couldn’t ever imagine leaving; every morning I would wake up excited to go and face new challenges and do fascinating new things. In the last 6-12 months so much has changed, as Last.fm gradually slips out of being a startup to being a company that, for better or for worse, has to make some money. I will certainly think twice before working for a company that has anything to do with the music industry… it’s a pain of a situation.

I’ve babysat the wonderful creation that is Last.fm through launches (both expected and unexpected), crashes (always unexpected), overheatings (and break-ins, and power failures… All the kind of thing that should never happen to a datacentre) and plenty of blood, sweat and tears.

It’s been an amazing experience, working with some of the most amazing people I have ever met (some of which have come and gone), but it’s time for me to help another startup through getting up at 4am to fix databases and exciting scaling questions.

And that will be Etsy; another website that has an awesome product that I love, plenty of traffic and graphs that point upwards and a bunch of guys who are passionate and have an awesome method of working. I’m really excited about getting involved and learning things again, as well as enabling a different group of passionate users go about their day to day business. I’ll still be in London, but popping to NY on occasion.

Let’s hope the next 3.43 years will be just as exciting.